
Overview #
This was the project where things clicked. Third block of my first year, and for the first time I wasn’t just reading about model training — I was doing it. Look-Out-Traffic is a traffic sign recognition system that classifies priority road signs using a CNN powered by transfer learning with EfficientNetB0. It achieved 100% test accuracy across five sign classes, surpassing human-level performance of 92.5%.
More than the numbers, this project introduced me to computer vision — a field that became one of my main interests and continues to shape the direction of my work today.
The Problem #
Autonomous vehicles depend on Traffic Sign Recognition (TSR) to make safe, real-time decisions. But current systems — even from companies like Tesla, Mobileye, and Volvo — still struggle in challenging conditions: poor lighting, adverse weather, damaged or obstructed signs.
Add distracted driving to the mix — responsible for over 3,000 fatalities in Europe in 2019 — and the need becomes clear: vehicles need to recognize signs reliably even when the driver isn’t paying attention.
Look-Out-Traffic focuses on priority signs specifically, because they carry the most immediate consequences: stop, yield, or go.
Building the Dataset #
Before any model training, there was data collection. I manually gathered 90% of the 702 images using Mapillary and Google Street View — screenshot by screenshot, sign by sign. The remaining 10% came from public datasets on RoboFlow and Kaggle. Every image was cleaned, standardized to JPG, cropped to isolate the sign, and resized to 128×128px across five classes: Full Stop, Give Way, Give Way to Oncoming Traffic, Priority Road, and Priority Over Oncoming Traffic.
It was tedious work, but it taught me something important — the quality of your data matters more than the complexity of your model.
The Iterations #
I didn’t jump straight to the best model. I worked through four iterations, each one building on what the previous one got wrong. Here are the three that tell the most interesting story.
Iteration 1: MLP #
The first model was a simple MLP — three dense layers, no convolutional layers, and an accuracy somewhere between 65 and 75%. That sounds reasonable until you remember that random guessing already gives you 20%.
The problem is structural. An MLP flattens the image into one long list of numbers before processing it, which means all spatial information is gone before the network even starts. It has no concept of shapes, edges, or the fact that neighbouring pixels form meaningful patterns. For image classification, that approach hits a ceiling pretty quickly, and seeing it happen in practice made the case for convolutional layers in a way that reading about them never quite did.
Iteration 2: Basic CNN #
Adding convolutional layers pushed accuracy up to 80–92%, but what was more interesting than the number was the confusion matrix. The model kept mixing up Give Way and Give Way to Oncoming Traffic, which was one of the harder classification errors to explain. Interestingly, the humans in my survey struggled with the same pair. The other recurring issue was that whenever the model was uncertain, it defaulted to predicting Stop signs, simply because Stop was the most common class in the dataset. It’s a good example of how a model learns the statistics of your data as much as it learns the task itself.
Iteration 4: EfficientNetB0 #
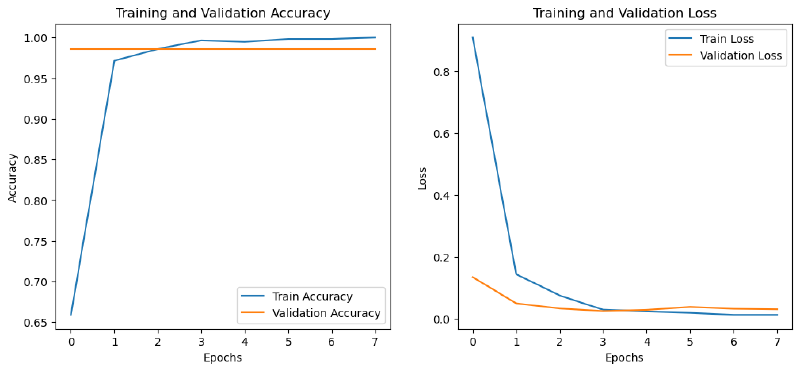
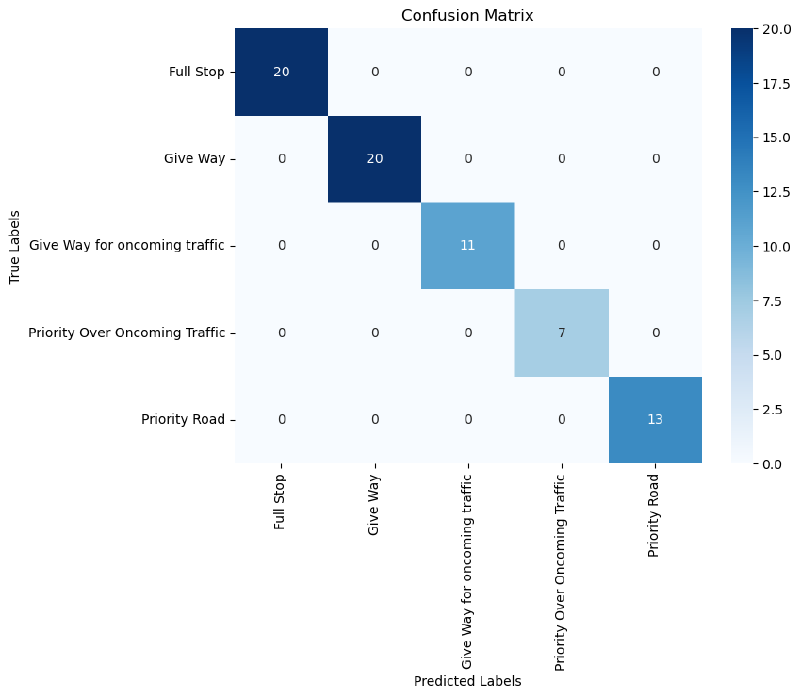
Transfer learning with EfficientNetB0 is what took accuracy to 100%. Rather than learning visual features from scratch on 702 images, the model started with weights pre-trained on ImageNet and only needed to learn how to map those features to my five sign classes. The difference was immediate. The confusion matrix came out as a clean diagonal and the error analysis found just two misclassified images in the whole test set, one due to a partially blocked sign and one due to image noise.
I also tested MobileNet before settling on EfficientNetB0. Both worked well, but EfficientNetB0 handled the small dataset more consistently, which I think comes down to how it scales across depth, width and resolution simultaneously rather than treating those as separate choices.
Measuring Against Humans #
Before building any model, I ran a survey with 6 participants to benchmark human performance. The result: 92.5% average accuracy. Stop signs were universally recognized (100%), but Priority Road signs dropped to 83.3% — likely because they’re less universally familiar than Stop or Give Way. The final EfficientNetB0 model outperformed every human participant across every class.
Key Results #
| Model | Test Accuracy |
|---|---|
| Random Guess | 20% |
| MLP | 65–75% |
| Basic CNN | 80–92% |
| CNN + Data Augmentation | 81–93% |
| MobileNet Transfer Learning | 90%+ |
| EfficientNetB0 Transfer Learning | 100% |
| Human-Level Performance | 92.5% |
Reflections #
Looking back, this project was a turning point. It was my first real encounter with convolutional neural networks, transfer learning, and the full pipeline from data collection to deployment-ready evaluation. Building the dataset manually was the most time-consuming part, but it gave me an intuition for data quality that no textbook could.
The jump from 69% (MLP) to 100% (EfficientNetB0) wasn’t just a metric improvement — it showed me what’s possible when you choose the right tool for the problem. And the error analysis from earlier iterations taught me that understanding why a model fails is just as valuable as celebrating when it succeeds.
This is where my interest in computer vision started. Everything that came after — sign language recognition, camera angle variance research — traces back to this project.